3,310,554 (2025 est.)
 West Bank
Key facts and a structured country profile. 🧾 Change log 📐 True Size
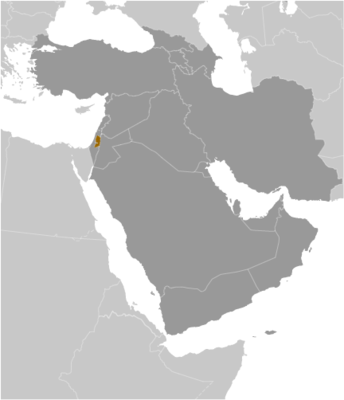
Locator 🗺️ Map
5,860 sq km
Middle East, west of Jordan, east of Israel
🧭 Background
The landlocked West Bank -- the larger of the two Palestinian territories -- is home to some three million Palestinians. Inhabited since at least the 15th century B.C., the area currently known as the West Bank has been dominated by a succession of different powers. In the early 16th century, it was incorporated into the Ottoman Empire. The West Bank fell to British forces during World War I, becoming part of the British Mandate of Palestine. After the 1948 Arab-Israeli War, Transjordan (later renamed Jordan) captured the West Bank and annexed it in 1950; Israel then captured it in the Six-Day War in 1967. Under the Oslo Accords -- a series of agreements that were signed between 1993 and 1999 -- Israel transferred to the newly created Palestinian Authority (PA) security and civilian responsibility for the many Palestinian-populated areas of the West Bank, as well as the Gaza Strip. In addition to establishing the PA as an interim government, the Oslo Accords divided the West Bank into three areas, with one fully managed by the PA (Area A), another fully managed by Israel (Area C), and a third with shared control (Area B) until a permanent agreement could be reached between the Palestine Liberation Organization (PLO) and Israel. In 2000, a violent intifada, or uprising, began across the Palestinian territories, and in 2001, negotiations for a permanent agreement between the PLO and Israel on final status issues stalled. Subsequent attempts to re-start direct negotiations have not resulted in progress toward determining final status of the area. The PA last held national elections in 2006, when the Islamic Resistance Movement (HAMAS) won a majority of seats in the Palestinian Legislative Council (PLC). Fatah, the dominant Palestinian political faction in the West Bank, and HAMAS failed to maintain a unity government, leading to violent clashes between their respective supporters and to HAMAS's violent seizure of all PA military and governmental institutions in the Gaza Strip in 2007. In 2018, the Palestinian Constitutional Court dissolved the PLC. In recent years, Fatah and HAMAS have made several attempts at reconciliation, but the factions have been unable to implement agreements.
🗺️ Geography
Middle East, west of Jordan, east of Israel
32 00 N, 35 15 E
Middle East
5,860 sq km
5,640 sq km
220 sq km
Slightly smaller than Delaware
478 km
Israel 330 km; Jordan 148 km
0 km (landlocked)
None (landlocked)
Temperate; temperature and precipitation vary with altitude, warm to hot summers, cool to mild winters
Mostly rugged, dissected upland in west, flat plains descending to Jordan River Valley to the east
Khallat al Batrakh 1,020 m
Dead Sea -431 m
Arable land
64.9% (2023 est.)
Arable land: 7% (2023 est.)
Permanent crops: 11.8% (2023 est.)
Permanent pasture: 46.1% (2023 est.)
1.8% (2023 est.)
32.1% (2023 est.)
(2013) 151 sq km; note - includes Gaza Strip
Dead Sea (shared with Jordan and Israel) - 1,020 sq km note - endorheic hypersaline lake; 9.6 times saltier than the ocean; lake shore is 431 meters below sea level
The most populous Palestinian communities in the West Bank are located in the central ridge and western half of its territory; Jewish settlements are located throughout the West Bank, the most populous in the Seam Zone -- between the 1949 Armistice Line and the separation barrier -- and around Jerusalem
Droughts
Landlocked; highlands are main recharge area for Israel's coastal aquifers (2017)
👥 People and Society⬆️ Top
3,310,554 (2025 est.)
1,682,493
1,628,061
Palestinian Arab, Jewish, other
Arabic, Hebrew (spoken by Israeli settlers and many Palestinians), English (widely understood)
كتاب حقائق العالم، المصدر الذي لا يمكن الاستغناء عنه للمعلومات الأساسية (Arabic) The World Factbook, the indispensable source for basic information.
Muslim 80-85% (predominantly Sunni), Jewish 12-14%, Christian 1-2.5% (mainly Greek Orthodox), other, unaffiliated, unspecified <1% (2012 est.)
36.7% (male 609,497/female 579,227)
59.5% (male 979,719/female 949,746)
3.9% (2024 est.) (male 59,234/female 65,946)
68.2 (2025 est.)
61.4 (2025 est.)
6.8 (2025 est.)
14.8 (2025 est.)
22 years (2025 est.)
21.6 years
22.1 years
2.03% (2025 est.)
27.24 births/1,000 population (2025 est.)
3.2 deaths/1,000 population (2025 est.)
-3.71 migrant(s)/1,000 population (2025 est.)
The most populous Palestinian communities in the West Bank are located in the central ridge and western half of its territory; Jewish settlements are located throughout the West Bank, the most populous in the Seam Zone -- between the 1949 Armistice Line and the separation barrier -- and around Jerusalem
77.6% of total population (2023)
2.85% annual rate of change (2020-25 est.)
1.06 male(s)/female
1.05 male(s)/female
1.03 male(s)/female
0.9 male(s)/female
1.03 male(s)/female (2024 est.)
16 deaths/100,000 live births (2023 est.)
14.2 deaths/1,000 live births (2025 est.)
17.5 deaths/1,000 live births
12.6 deaths/1,000 live births
76.5 years (2024 est.)
74.4 years
78.8 years
3.44 children born/woman (2025 est.)
1.67 (2025 est.)
Urban: 98% of population (2022 est.)
Rural: 100% of population (2022 est.)
Total: 98.4% of population (2022 est.)
Urban: 2% of population (2022 est.)
Total: 1.6% of population (2022 est.)
13.5% of national budget (2022 est.)
3.25 physicians/1,000 population (2020)
1.3 beds/1,000 population (2019 est.)
Urban: 100% of population (2022 est.)
Rural: 99% of population (2022 est.)
Total: 99.8% of population (2022 est.)
Urban: 0% of population (2022 est.)
Rural: 1% of population (2022 est.)
Total: 0.2% of population (2022 est.)
2.1% (2020 est.)
62.4% (2020 est.)
0.7% (2020)
13.4% (2020)
5.4% of GDP (2021 est.)
98% (2022 est.)
99% (2022 est.)
97% (2022 est.)
13 years (2023 est.)
12 years (2023 est.)
14 years (2023 est.)
🌿 Environment⬆️ Top
Adequacy of freshwater supply; sewage treatment
Temperate; temperature and precipitation vary with altitude, warm to hot summers, cool to mild winters
64.9% (2023 est.)
Arable land: 7% (2023 est.)
Permanent crops: 11.8% (2023 est.)
Permanent pasture: 46.1% (2023 est.)
1.8% (2023 est.)
32.1% (2023 est.)
77.6% of total population (2023)
2.85% annual rate of change (2020-25 est.)
3.913 million metric tonnes of CO2 (2023 est.)
3.913 million metric tonnes of CO2 (2023 est.)
31.3 micrograms per cubic meter (2019 est.)
1.387 million tons (2024 est.)
251 million cubic meters (2022)
37 million cubic meters (2022)
158 million cubic meters (2022)
837 million cubic meters (2022 est.)
🏛️ Government⬆️ Top
None
West Bank
Name refers to the location of the British Mandate of Palestine that was occupied and administered by Jordan in 1948, on the west bank of the Jordan River; the designation was retained after the 1967 Six-Day War and subsequent changes in administration
4 (all cultural)
Ancient Jericho/Tell es-Sultan; Birthplace of Jesus: Church of the Nativity and the Pilgrimage Route, Bethlehem; Hebron/Al-Khalil Old Town; Land of Olives and Vines – Cultural Landscape of Southern Jerusalem, Battir
💹 Economy⬆️ Top
$20.339 billion (2024 est.)
$27.694 billion (2023 est.)
$29.016 billion (2022 est.)
-26.6% (2024 est.)
-4.6% (2023 est.)
4.1% (2022 est.)
$3,800 (2024 est.)
$5,400 (2023 est.)
$5,800 (2022 est.)
$13.711 billion (2024 est.)
53.7% (2024 est.)
5.9% (2023 est.)
3.7% (2022 est.)
5.7% (2022 est.)
17.4% (2022 est.)
58.3% (2022 est.)
95.5% (2024 est.)
20.7% (2024 est.)
24.7% (2023 est.)
1.7% (2024 est.)
21% (2024 est.)
-60.3% (2024 est.)
Tomatoes, cucumbers, olives, poultry, milk, potatoes, sheep milk, eggplants, gourds
Small-scale manufacturing, quarrying, textiles, soap, olive-wood carvings, and mother-of-pearl souvenirs
-32.2% (2024 est.)
1.391 million (2022 est.)
24.5% (2022 est.)
26.4% (2021 est.)
25.9% (2020 est.)
36.1% (2022 est.)
31.6% (2022 est.)
56.6% (2022 est.)
29.2% (2016 est.)
36.4 (2023 est.)
2.5% (2023 est.)
27.1% (2023 est.)
5.4% of GDP (2024 est.)
18.2% of GDP (2023 est.)
24% of GDP (2022 est.)
$1.409 billion (2021 est.)
$1.499 billion (2021 est.)
23.8% of GDP (2013 est.)
21.5% (of GDP) (2021 est.)
-$2.899 billion (2024 est.)
-$2.895 billion (2023 est.)
-$2.037 billion (2022 est.)
$2.885 billion (2024 est.)
$3.413 billion (2023 est.)
$3.533 billion (2022 est.)
Jordan 51%, Turkey 12%, UAE 8%, Saudi Arabia 5%, UK 4% (2023)
Scrap iron, tropical fruits, olive oil, building stone, prepared meat (2023)
$8.264 billion (2024 est.)
$11.637 billion (2023 est.)
$12.257 billion (2022 est.)
Egypt 25%, Jordan 17%, China 8%, Germany 7%, UAE 7% (2023)
Cement, raw sugar, cars, baked goods, perfumes (2023)
$1.328 billion (2024 est.)
$1.323 billion (2023 est.)
$896.9 million (2022 est.)
New Israeli shekels (ILS) per US dollar -
3.7 (2024 est.)
3.67 (2023 est.)
3.36 (2022 est.)
3.23 (2021 est.)
3.442 (2020 est.)
⚡ Energy⬆️ Top
100% (2022 est.)
352,000 kW (2023 est.)
6.956 billion kWh (2023 est.)
6.925 billion kWh (2023 est.)
988 million kWh (2023 est.)
66.5% of total installed capacity (2023 est.)
33.5% of total installed capacity (2023 est.)
1 metric tons (2023 est.)
29,000 bbl/day (2023 est.)
14.991 million Btu/person (2023 est.)
📡 Communications⬆️ Top
383,653 (2023 est.)
7 (2023 est.)
4,148,420 (2023 est.)
77 (2023 est.)
The Palestinian Authority operates 1 TV and 1 radio station; about 20 private TV and 40 radio stations; Jordanian TV and satellite TV accessible
.ps
87% (2023 est.)
431,000 (2023 est.)
8 (2023 est.)
🚚 Transportation⬆️ Top
1 (2025)
2 (2025)
🛡️ Military and Security⬆️ Top
Per the Oslo Accords, the Palestinian Authority (PA) is not permitted a conventional military but maintains security and police forces; PA security personnel have operated exclusively in the West Bank since HAMAS seized power in the Gaza Strip in 2007; PA forces include the Palestinian National Security Forces, Presidential Guard, Civil Police, Civil Defense, Preventive Security Organization, the General Intelligence Organization, and the Military Intelligence Organization (2024)
Not available
The PA police and security forces have approximately 28,000 active personnel, including about 11,500 National Security Forces (2024)
Palestinian Authority security forces maintain security control of 17.5% (called Area A) of the West Bank, as agreed by the Palestine Liberation Organization and Israel in the Oslo Accords, although Israeli security forces frequently conducted security operations there; Israeli security forces maintain responsibility for the remaining 82.5% of the West Bank, including Area B (22.5%), where the Palestinian Authority has administrative control, and Area C (60%), where Israel maintains administrative control (2024)
🚨 Terrorism⬆️ Top
Al-Aqsa Martyrs Brigade; HAMAS; Palestine Islamic Jihad; Palestine Liberation Front; Popular Front for the Liberation of Palestine
🌐 Transnational Issues⬆️ Top
2,032,011 (2024 est.)
Source: Factbook JSON archive.